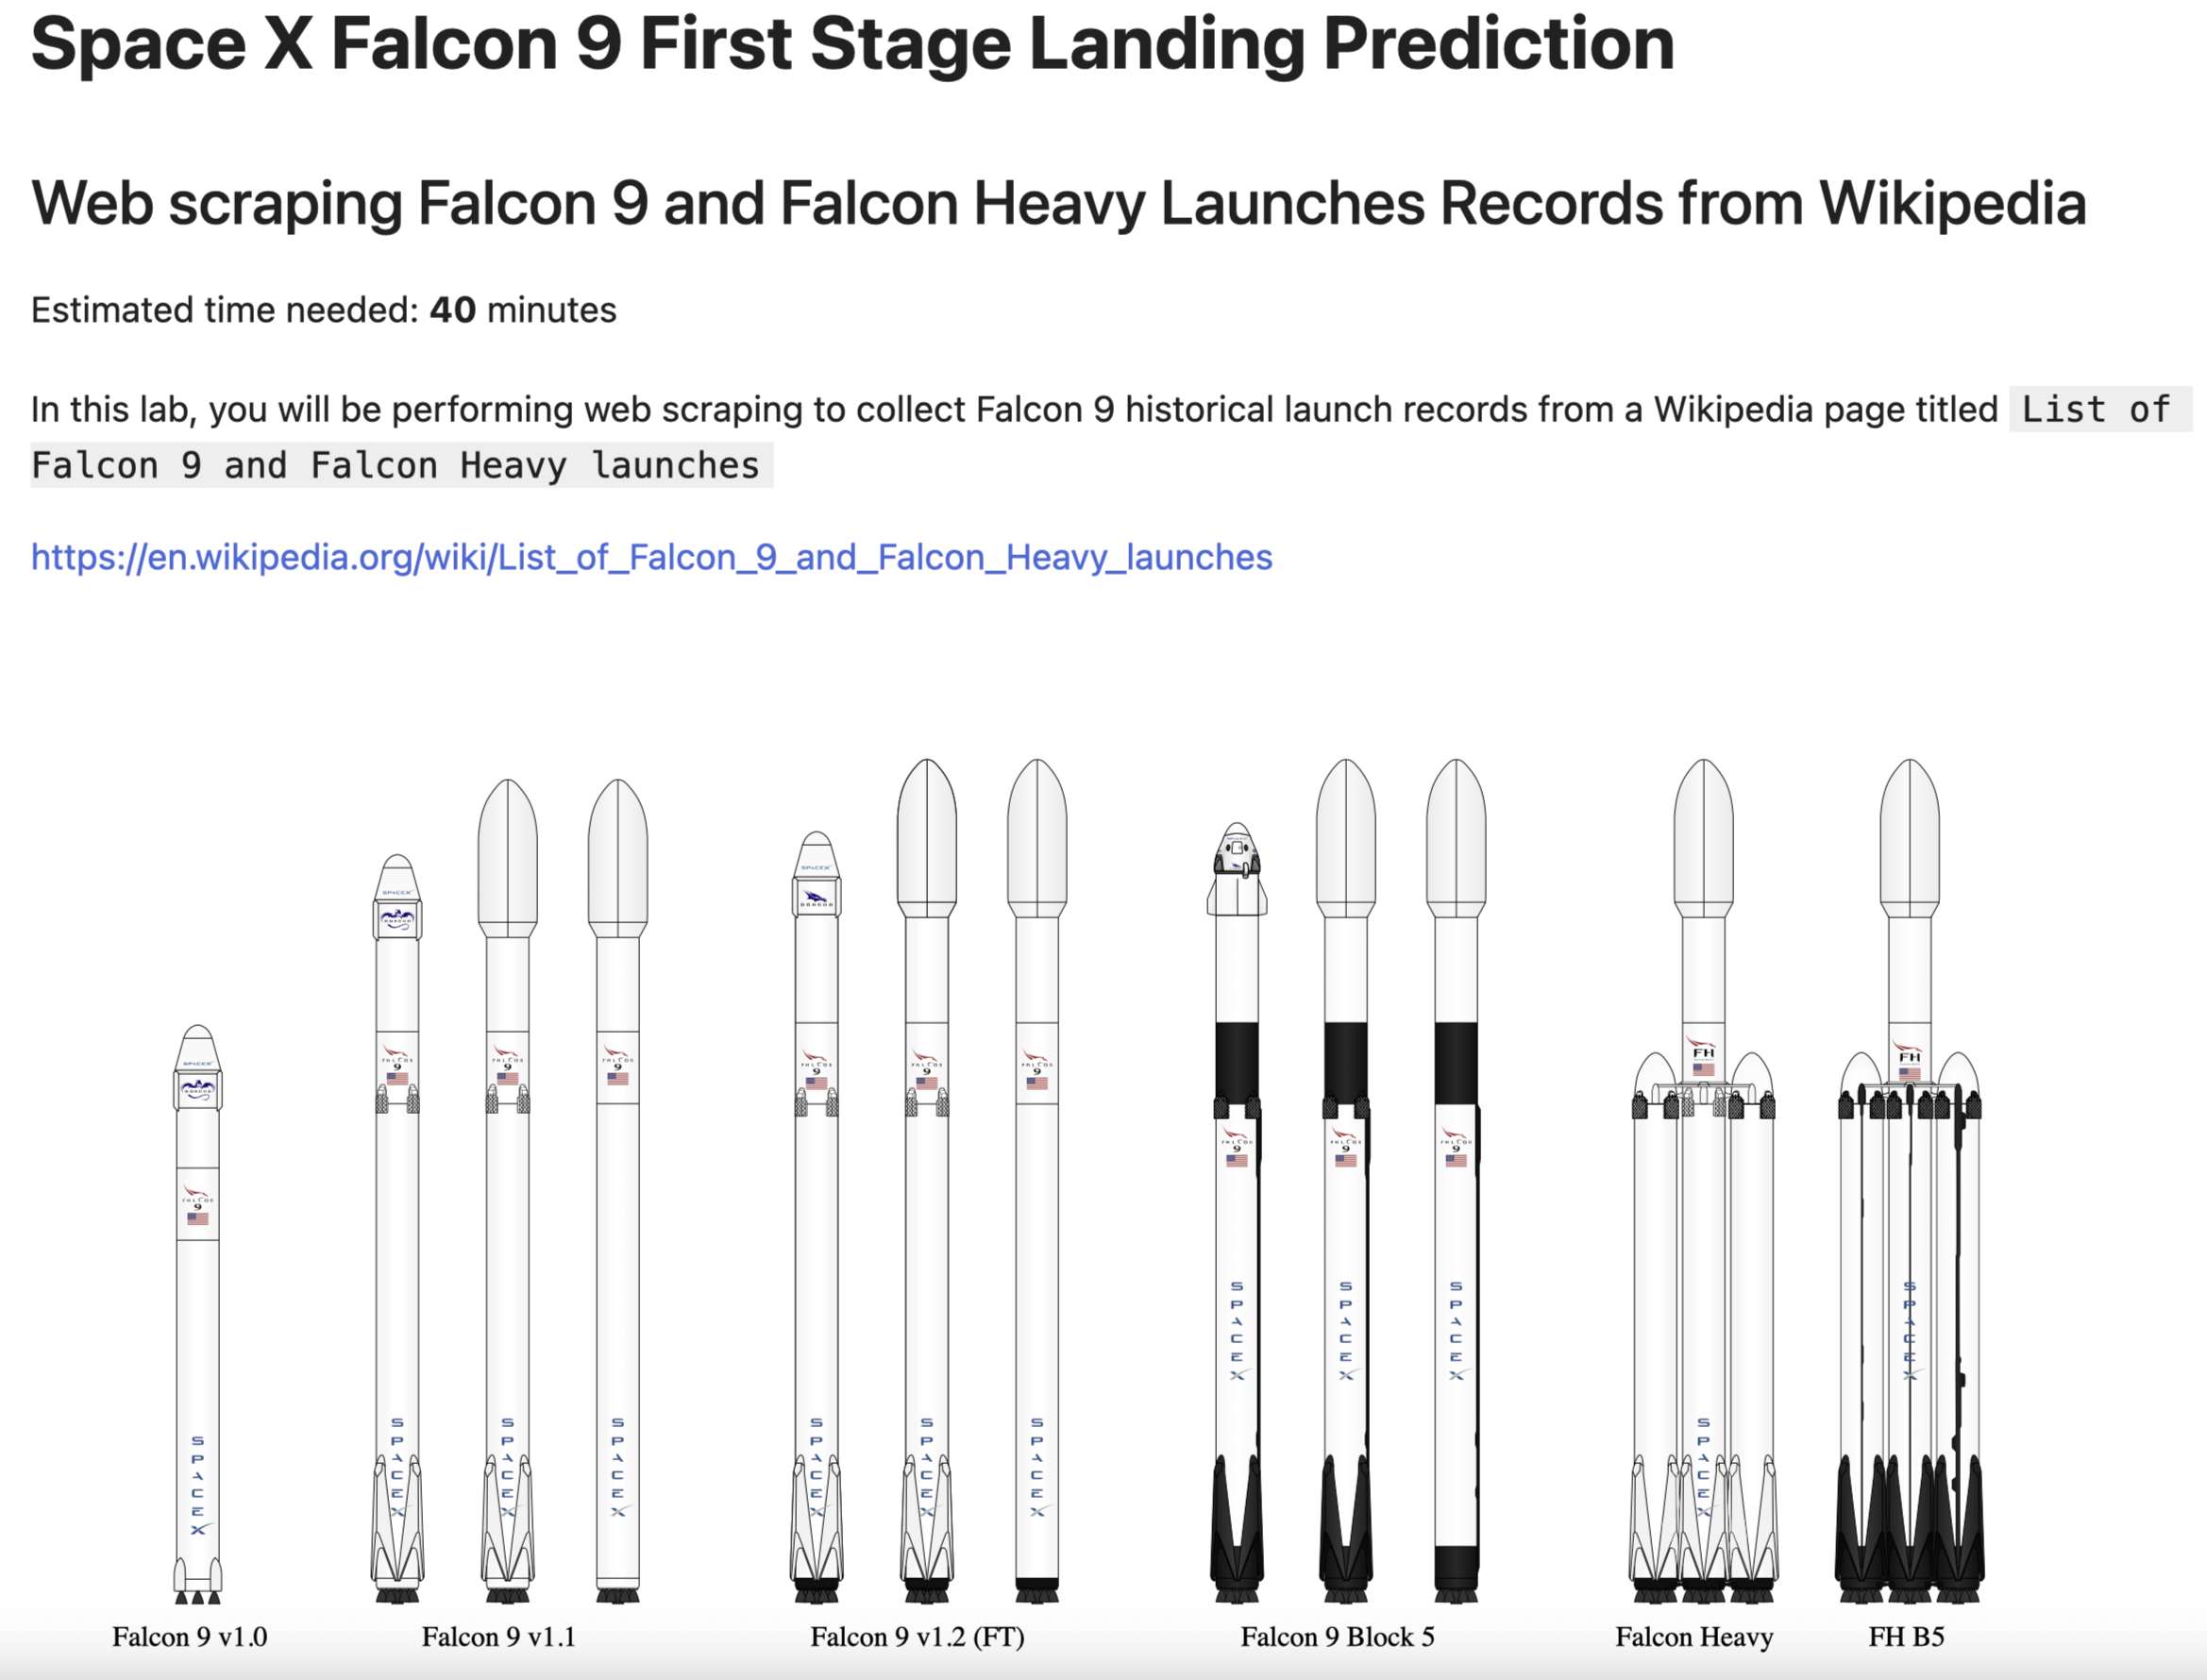
From May 2025 to July 2025, I completed a 5-week, 45-hour capstone project for the IBM Data Science Professional Certificate as part of my B.S. in Computer Science from MSU Denver. This project analyzed SpaceX launch outcomes, building a full data science pipeline to predict mission success using Python, machine learning, and interactive dashboards.
👉 View IBM Data Science Specialization Certificate
👉 View GitHub Repository
🔍 Project Highlights
- Designed a Python-based data science pipeline across five weeks, integrating SpaceX REST API and web scraping.
- Built interactive dashboards with Plotly Dash and Folium for launch site analysis.
- Achieved >90% accuracy in predicting launch outcomes using machine learning classifiers.
- Delivered a technical presentation summarizing methodology and insights.
📦 My Role: Data Scientist
- Pipeline Development: Built and executed a data science workflow, from data collection to model deployment.
- Data Analysis: Performed web scraping, data wrangling, and exploratory analysis with Pandas and SQL.
- Visualization: Created interactive dashboards using Plotly Dash and Folium maps.
- Modeling: Developed and tuned machine learning classifiers (Logistic Regression, Decision Trees).
- Presentation: Authored a technical report and presentation for Coursera evaluation.
This role strengthened my skills in data science, machine learning, and data visualization.
👥 Contributors and Credits
A solo-led academic project for the IBM Data Science Professional Certificate, completed for educational purposes.
✨ Key Features
The SpaceX Launch Analysis project offers:
- Data Collection: Extracted launch data via SpaceX REST API and web scraping with BeautifulSoup.
- Data Wrangling: Cleaned and preprocessed data using Pandas.
- Exploratory Analysis: Generated scatter plots, bar charts, and SQL-based insights.
- Geolocation Visualization: Mapped launch sites with Folium.
- Interactive Dashboards: Built real-time filtering dashboards with Plotly Dash.
- Predictive Modeling: Classified launch outcomes with >90% accuracy using scikit-learn.
Integrations: SpaceX REST API, Plotly Dash, Folium, Jupyter Notebooks.
🛠️ Technologies Used
- Languages/Libraries: Python, Pandas, scikit-learn, Plotly, BeautifulSoup, Folium
- Tools: Jupyter Notebooks, GitHub, SQL
- Workflow: Data wrangling, visualization, statistical modeling, dashboarding
- Documentation: README, Technical Presentation
📁 Repository Contents
| Resource | Description |
|---|---|
| SpaceX_API.ipynb | Data collection via SpaceX REST API |
| Web_Scraping.ipynb | HTML scraping for additional launch records |
| Data_Wrangling.ipynb | Data cleaning and preprocessing |
| EDA_Visualization.ipynb | Scatter plots, bar charts, and line graphs |
| EDA_SQL.ipynb | SQL-based payload and booster insights |
| Folium_Map.ipynb | Launch site geolocation and outcomes |
| Plotly_Dash.ipynb | Interactive dashboard with filters and metrics |
| Predictive_Analysis.ipynb | Classification model predictions |
📈 Project Rigor
The GitHub repository showcases:
- Structured commit history across five weeks (May–July 2025).
- Comprehensive Jupyter notebooks covering API integration, web scraping, analysis, visualization, and modeling.
- Locally deployed Plotly Dash dashboards for interactive exploration.
Setup:
- Clone:
git clone https://github.com/willmaddock/Data-Science-Capstone-SpaceX.git - Install dependencies:
pip install -r requirements.txt - Run notebooks: Use Jupyter to execute
SpaceX_API.ipynb,Plotly_Dash.ipynb, etc. - See README for details.
Data Science Pipeline:
🔗 Links and Resources
- IBM Data Science Specialization Certificate
- GitHub Repository
- Project README
- Technical Presentation
- MDN Web Docs
- Pandas Documentation
- scikit-learn Documentation
- Plotly Python Documentation
© 2025 William Maddock - All Rights Reserved
